- CloudAICrypto
- Pages
- Elliot Wave Theory
Elliot Wave Theory
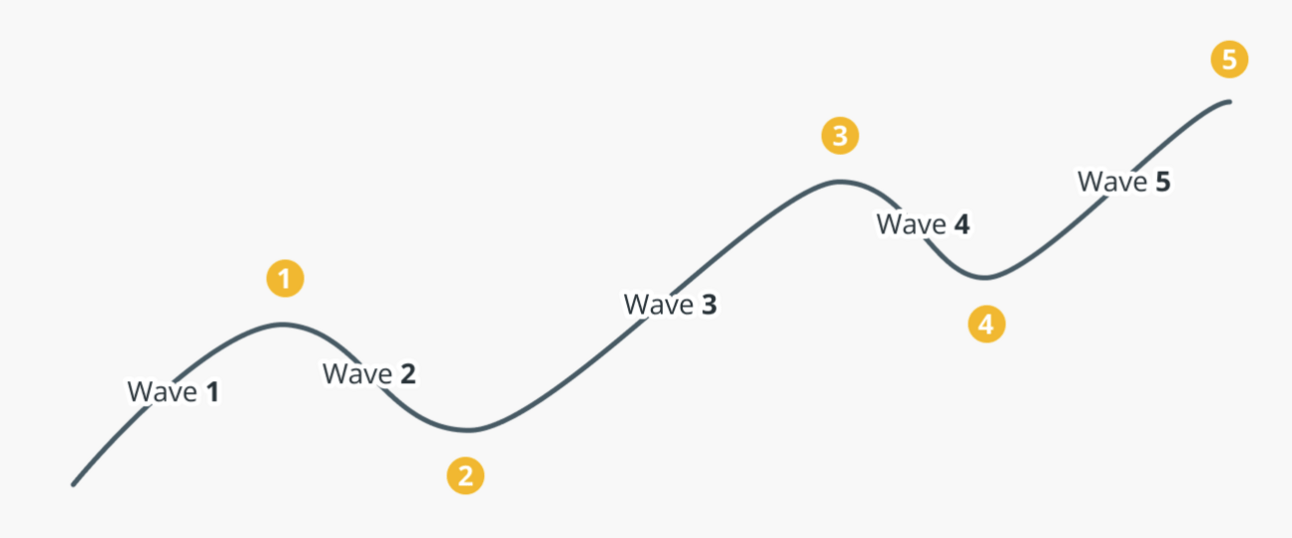
The Elliott Wave theory is a widely used method in technical analysis that aims to predict market behavior through crowd psychology. This theory divides price movements into impulsive waves, which drive the trend, and corrective waves, which pull back from the trend. An impulse wave consists of five waves, while a correction consists of three, creating a cyclical pattern that repeats across different time frames.

Because Elliott waves are fractal, this cycle remains constant at all scales, producing recognizable formations such as triangles, zigzag corrections, and expanded flats. Understanding these patterns allows traders to identify opportunities, especially when using the five smart drawing tools available to chart these movements. The challenge lies in correctly counting the waves, as success hinges on following strict guidelines and rules for proper interpretation.
Using Elliot Wave Theory For Trading Cryptocurrency
When applying Elliott Wave Theory to the cryptocurrency market, traders may find that patterns can be challenging to identify at first. The market rarely presents a textbook example of Elliott’s concepts. However, several key rules can help clarify the trading patterns.
First, wave two will never fully retrace the gains made by wave one. Wave three is typically the largest and will often be longer than wave one, but it should never be the shortest of the three main waves. Lastly, wave four should not drop below the peak of wave one, as this would nullify the overall trend.
With these guidelines, traders can navigate crypto charts more confidently. Here’s a step-by-step approach for applying the theory:
Determine if the market's primary trend is bullish or bearish.
Label the waves to identify patterns.
Combine other tools, like the relative strength index (RSI) and the Elliott Wave Oscillator, to confirm trends and validate the wave count.
Remember, waves can extend over days, weeks, or even years. The wave degree refers to the duration of these market cycles.
The Elliot Wave Theory In Action
Elliott Wave Analysis of Bitcoin: Strong Bullish Run, But for How Long?

The chart provides a comprehensive Elliott Wave analysis of Bitcoin’s price action between October 2022 and April 2023. This analysis highlights a substantial bullish trend from December 2022 to April 2023, indicating positive momentum during this period.
Nonetheless, warning signs have appeared. Indicators such as divergence and momentum reversal, alongside the irregular correction in wave 4, raise concerns that the bullish momentum might be losing steam. These factors could lead to a potential trend reversal or weakening of Bitcoin's price gains. Remember, though, that Elliott Wave Theory is inherently subjective, and different analysts might interpret the same chart in various ways.